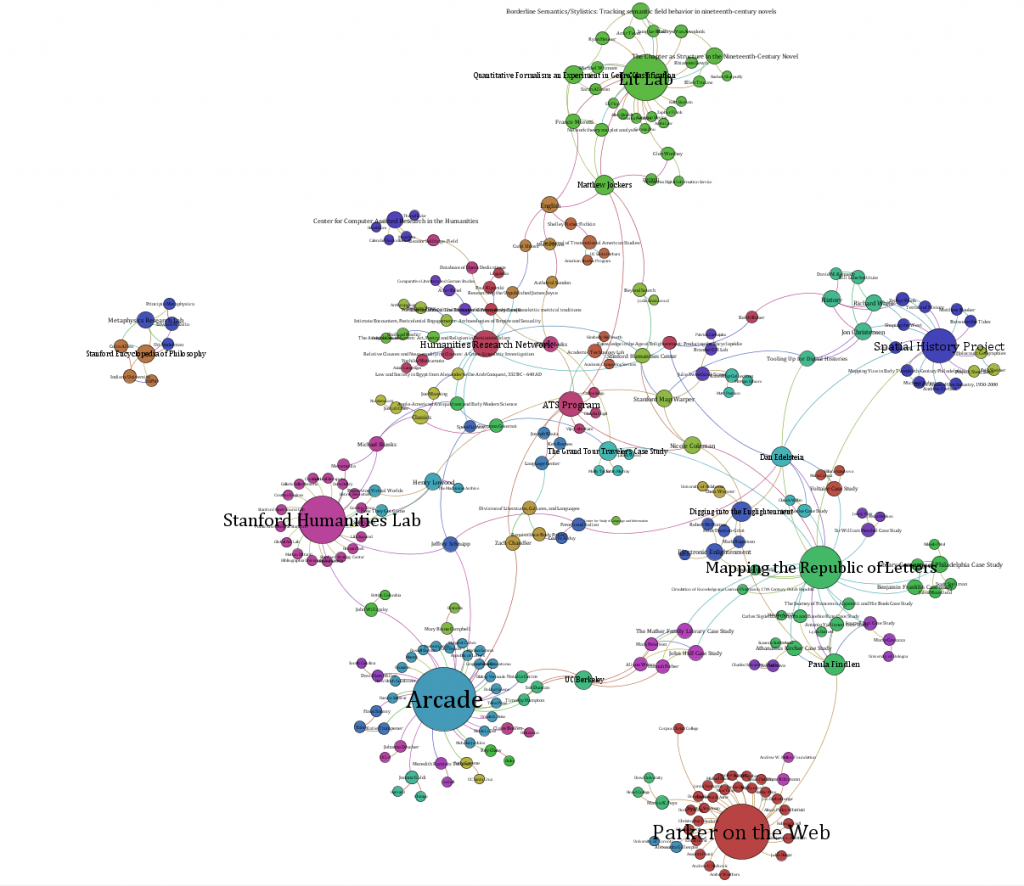
To facilitate discussion of metrics, definition and suitability, I’ve added a new page focused on visualizing and analyzing the Digital Humanities network at Stanford. I found at THATCamp and here at Stanford that this can cause agitation and consternation and so I think an open forum on developing standards and practices for visualizing digital humanities networks (whether at Stanford or elsewhere) would prove useful.
Categories
- Algorithmic Literacy
- Amusing Historical Map Features
- Big Data
- D3
- DH2011
- Digital Humanities at Stanford
- Digital Scholarly Work
- Drupal
- Gaming
- Graph Data Model
- HGIS
- Interview
- Multiscale Applications
- Natural Law
- New Aesthetic
- New Literature
- ORBIS
- Pedagogy
- Peer Review
- Reviews
- Social Media Literacy
- Spatial Humanities
- Text Analysis
- The Digital Humanities as…
- Tools
- Uncategorized
- Visualization
Meta


Pingback: Tweets that mention The Digital Humanities as a Network Map | Digital Humanities Specialist -- Topsy.com